What additional performance overhead does the use of iterators and closures cause?

Update

I noticed that most people focus on how to conduct strict benchmark testing and how to make the program fun faster. but tha't not my concern . I dont' care which way is faster. What I want to know is whether there are really no extra operations at all after the iterator is optimized by the optimizer. I have some doubts about hte true meaning of zero cost.


Hello everyone. Please look at the following code first:

use std::time::SystemTime;
fn main(){

    let v = Box::new(vec![0u8;1_000_000_000]);
    let mut v1 = v.clone();
    let mut v2 = v.clone();
    drop(v);
    

    let start = SystemTime::now();
    t1(&mut v1);
    println!("t1: {} ms",SystemTime::now().duration_since(start).unwrap().as_millis());

    let start = SystemTime::now();
    t2(&mut v2);
    println!("t2: {} ms",SystemTime::now().duration_since(start).unwrap().as_millis());
}

fn t1(v:&mut Vec<u8>){

    let length = v.len();
    let mut index = 0usize;
    loop {
        if index >=  length{
            break;
        }
        let element = &mut v[index];
        *element += 1;


        index += 1;
    }
 }
 
 fn t2(v:&mut Vec<u8>){
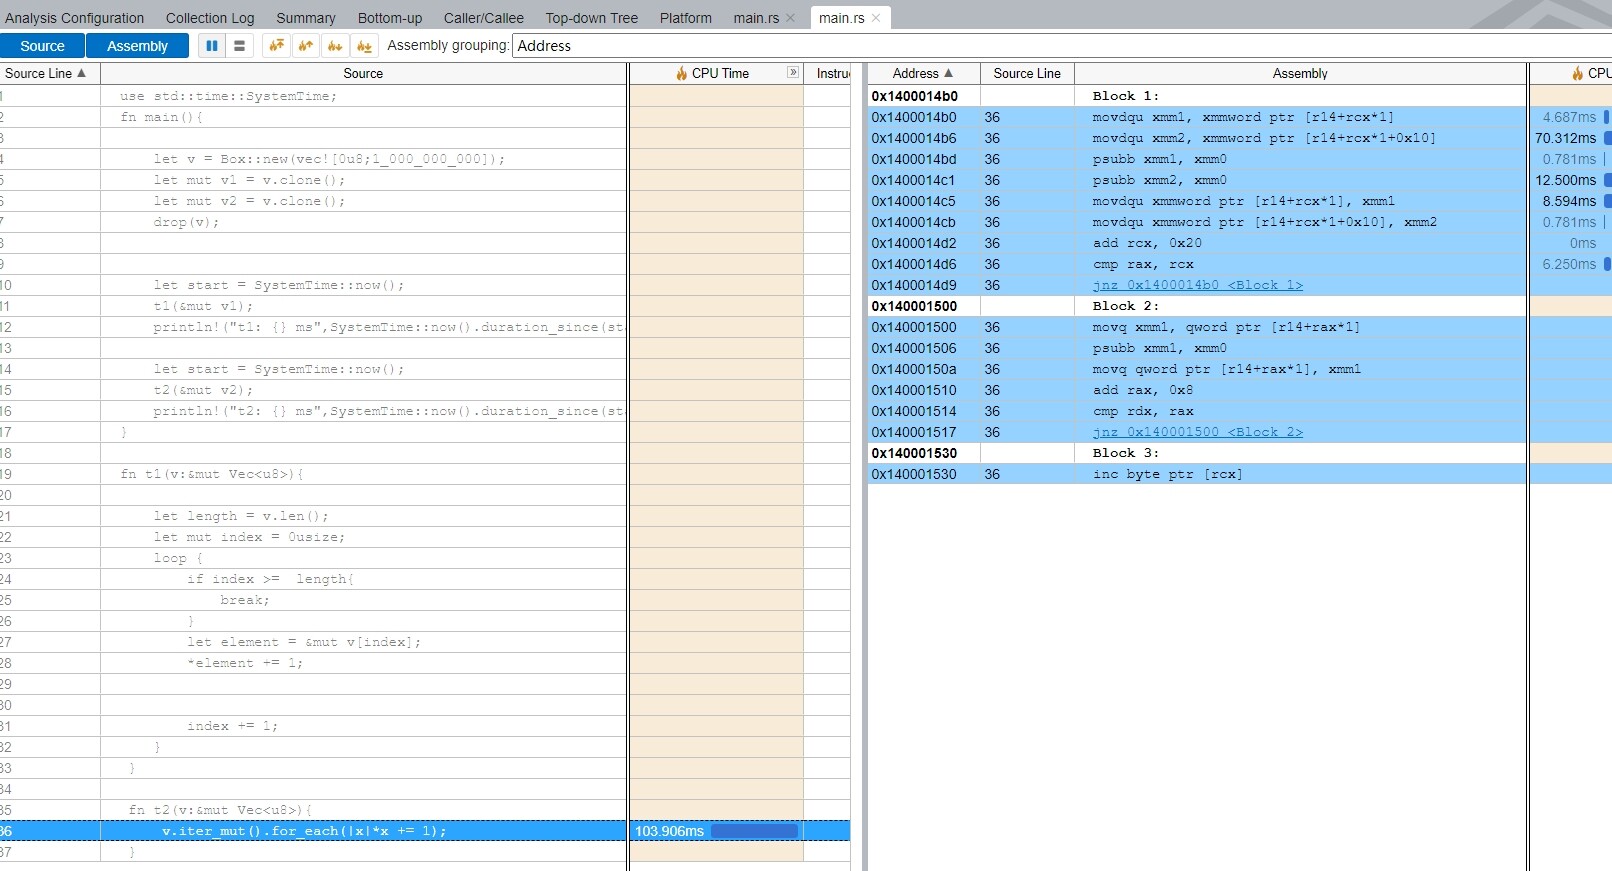
     v.iter_mut().for_each(|x|*x += 1);
 }

This code will use two methods to +1 values of all elements in Vec to analyze the performance of the two methods.

t1 uses a method similar to for loop in C language, and t2 uses interators and closures to implement.

Running under the Debug binary , t1 is about 1 second faster than t2 for operations of 1 billion elements. when running under release binary, opt_level=3, the perormance gap between t1 and t2 ranges from 1 to 30ms.

Now,I have two questions:

  1. What additional performance overhead does the use of iterators and closure cause? Although this additional performance overhead is almost negligible, I would like a very detailed answer.
  2. What more operations does the optimized t2 have than t1? Although I can analyze the performance of the program throught Intel Vtune Profiler, I do not understand some of the advanced assembly instructions of x64.

A friend of mine thinks that using iterators and closures has a huge performance overhead. I know that's not the case, but I can't convince him with the underlying technical principles; So I hope to get a more authoritative and detailed answer.

Thank you all.

Here's your code (plus one more variation) on the Rust playground (release mode) so people can easily compare the generated assembly.

Naively I would have expected all three variations to generate identical code, but they do not. You may have found a lacuna in the optimizer. I can't see enough of the assembly at once on this screen to say any more.

1 Like

In debug mode: abstractions (like iterators and closures) are present in the executable. For example iterators will repeatedly call the next function, and closures will be separate functions that get called. All of this is removed in optimized builds, which is why you see almost no difference there. The remaining tens of ms you still see in the difference could be either an error in the measurement or some small difference in how the optimizer transformed the two pieces of code. Also note that in some cases iterators could make your code faster due to being able to remove bound checks internally (while manual indexing might not always be optimized out)

4 Likes

The way you benchmark code may give misleading results. You should use Criterion or Rust's nightly Bencher.

  • SystemTime is not precise. Instant is for measuring time.

  • The compiler is free to inline and reorder code and move it out of your start/end. It's free to remove your benchmark code entirely if it doesn't give a visible result.

  • Running multiple tests one after another will be distorted by CPU caches, virtual memory, and CPU frequency. Tests need a warmup, longer runs, and removal of outliers.

Criterion is smart enough to protect against all these gotchas.

4 Likes

Given that SystemTime is commonly only good to about 16ms, that's not enough of a difference to say anything. As @kornel said, use a proper benchmarking library.

On the code side:

If you're not modifying the length of the vector, take &mut [u8] instead of &mut Vec<u8>. It's just a pure win -- both faster and more flexible.

If you do that then check https://rust.godbolt.org/z/3rbM58b48, you'll see that the indexing gives an inner loop of

.LBB0_6:
        vpaddb  ymm1, ymm0, ymmword ptr [rdi + rcx]
        vpaddb  ymm2, ymm0, ymmword ptr [rdi + rcx + 32]
        vpaddb  ymm3, ymm0, ymmword ptr [rdi + rcx + 64]
        vpaddb  ymm4, ymm0, ymmword ptr [rdi + rcx + 96]
        vmovdqu ymmword ptr [rdi + rcx], ymm1
        vmovdqu ymmword ptr [rdi + rcx + 32], ymm2
        vmovdqu ymmword ptr [rdi + rcx + 64], ymm3
        vmovdqu ymmword ptr [rdi + rcx + 96], ymm4
        sub     rcx, -128
        cmp     rax, rcx
        jne     .LBB0_6

and the iterator gives an inner loop of

.LBB1_8:
        vpaddb  ymm1, ymm0, ymmword ptr [rdi + rcx]
        vpaddb  ymm2, ymm0, ymmword ptr [rdi + rcx + 32]
        vpaddb  ymm3, ymm0, ymmword ptr [rdi + rcx + 64]
        vpaddb  ymm4, ymm0, ymmword ptr [rdi + rcx + 96]
        vmovdqu ymmword ptr [rdi + rcx], ymm1
        vmovdqu ymmword ptr [rdi + rcx + 32], ymm2
        vmovdqu ymmword ptr [rdi + rcx + 64], ymm3
        vmovdqu ymmword ptr [rdi + rcx + 96], ymm4
        sub     rcx, -128
        cmp     rax, rcx
        jne     .LBB1_8

They're exactly the same here: 4 operations on Simd<u8, 32> per iteration.

Or you can pull up the diff and see that it's just slightly different choices of boundary handling and register allocation. Nothing fundamental.

Thus the answer really isn't that interesting: if you don't optimize, then the extra layers aren't optimized away so the one that you wrote closer to the machine is faster. If you do optimize, then the optimizations do their job and it's the same.

But if you care about the runtime performance of your debug builds, put opt-level = 1 in your debug profile; don't change how you write the code.

10 Likes

I use Intel VTune Profiler to analyze performance, SystemTime does not affect the results;

I think you're right, I noticed some differences in their selection of registers. This is the code on my machine:

movdqu xmm1, xmmword ptr [rdi+rcx*1]
movdqu xmm2, xmmword ptr [rdi+rcx*1+0x10]
psubb xmm1, xmm0
psubb xmm2, xmm0
movdqu xmmword ptr [rdi+rcx*1], xmm1
movdqu xmmword ptr [rdi+rcx*1+0x10], xmm2
add rcx, 0x20
cmp rax, rcx
jnz 0x140001300 <Block 35>
movdqu xmm1, xmmword ptr [r14+rcx*1]    
movdqu xmm2, xmmword ptr [r14+rcx*1+0x10]   
psubb xmm1, xmm0    
psubb xmm2, xmm0    
movdqu xmmword ptr [r14+rcx*1], xmm1    
movdqu xmmword ptr [r14+rcx*1+0x10], xmm2   
add rcx, 0x20   
cmp rax, rcx    
jnz 0x1400014b0 <Block 66>  

There should be no performance difference between rdi and r14 registers;

t1 is written in the C language for loop style. Considering the existence of boundary checks, I changed t1 to the following form:

    for element in v{
        *element += 1;
    }

However, there is still a slight difference in performance.

Then I increased the number of elements to 5 billion, and something magical happened. t2 was faster, and not a little bit faster;

In the end what happened?

As @kornel notes, your benchmark is written with critical errors, so it doesn't prove anything at all. With a loop that simple and a benchmark that naive, the optimizer can fold the entire loop into a no-op, directly returning the vector with expected values, or even remove your benchmark loop entirely, since you don't use the resulting vectors in any way.

In general, there is no hard rule like "an iterator is always faster than a manual loop" or vice versa. Generally, iterator-based code is faster, since the stdlib iterators are heavily optimized and use precisely crafted unsafe code in their implementation, as well as some unstable compiler features. Writing an equivalent generic code is often impossible. Writing manual specializations for specific loops is tedious and error-prone, so most people won't do it, and just writing a C-style loop doesn't have any performance implications at all. C loops aren't magically faster than similar high-level code, unless you know what you're doing.

However, one can find plenty of cases where the compiler fails to fully optimize an iterator-based loop for whatever reasons. This means that in performance-critical sections of your code you should write proper benchmarks and setup CI jobs to test for regressions. You may also need to fall back to lower-level code, although that usually means "write your code in optimizer-friendly way" or "use strategically placed simd intrinsics" rather than "write C loops", which is never helpful on its own.

3 Likes

You are right, but there is a new problem. I changed t1 to the following form and increased the number of elements to 5 billion. t2 is faster than t1, more than twice;

    for element in v{
        *element += 1;
    }

what's going on , this code doesn't seem to have a bound check either.

Magical optimization

So your benchmark is still taking a zero-initialized vector, then incrementing each byte in loop 1, then incrementing each byte in loop 2, and loop 2 is faster even though they have the same code? Are you using Linux? The kernel might not initialize the actual memory until the bytes are actually being written to, which would be during the first loop. Some more explanation at memory management - Linux kernel: Role of zero page allocation at paging_init time - Stack Overflow

edit: I misunderstood your code, it looks like you did actually have separate buffers for each test. Regardless, that's one thing you should be wary of.

In fact, here the optimizer does not do what you said.

You are right, this test is not rigorous. But my purpose is to know what the optimizer does for these two methods. I don't care which one is faster. What I want to know is what the performance difference between them depends on.

My purpose is not to compare their performance, but to understand through analysis what the optimizer does and what causes the difference in performance between them.

Which CPU are you using?

The optimized code is using movdqu meaning no particular alignment is required but the runtime performance of these may vary with the actual alignment, which the Box<[u8; N]> doesn't guarantee. It might in practice, but that's one thing to check.

Is the difference in the two loops just whether rdi or r14 is used as the base register? At least in this case, using one of the r8-r15 register requires a REX-prefix, making each of those movdqu one byte larger, which might affect a bottleneck in the instruction decoding. You should get the disassembler to also show the encoded bytes to verify, on godbolt there's a "Compile to binary object"-checkbox under Output.

You're still using &mut Vec<u8>. Stop doing that, as I mentioned earlier.

It's because I have some other experiments to conduct; otherwise, I wouldn't need to use both Vec and Box here.

I don't see any reason why the optimizer shouldn't be expected to generate identical machine code for &mut Vec<u8> and for &mut [u8] in situations where it's possible to swap one for the other.

Well, they look meaningfully different to LLVM at the ABI level:

  • &mut Vec<u8> is passed as a pointer to the 3×usize struct, and it needs to load things from it to then index it
  • &mut [u8] is passed as a *mut u8 and a usize as two scalers.

(Obligatory disclaimer that this is not a guarantee, just what happens to be true today.)

So sure, it'd be nice if they optimized the same, but it's also entirely plausible that the thing that looks more like how things are passed all the time in code that clang sees will end up being handled better.

Especially given that passing the slice is just better from a generality and readability perspective too, so there's no reason not to do it that way.

That is definitely good advice in general. It just isn't important to what they were asking about. I believe the comment you quoted was in response to this:

And that is true, but it doesn't make the benchmark invalid. Once you've checked that the generated binary does in fact execute a loop that increments a billion bytes of memory (or whatever you wanted to measure), then what the compiler could have done is irrelevant.

My impression is that @hocn came here with a proposition analogous to "I'd like to understand why these two cars with a similar engine perform differently" and some of the responses have been more "It's better to track people on their commute to figure out the how the cars really perform."

Sure, maximizing engine performance probably won't help you get to work any faster, but if you want to understand how engines work, you don't need to care about traffic or steering.

3 Likes

You're calling them in the same main. That might have some ordering effects. Try running them as separate executions (branch in main based on an argument) and then profile the each execution.

Also look at other profiler statistics like page faults, IPC, tlb misses etc.

For the simple example iterator usage you gave, I would expect the compiler to produce optimal output. There isn't a guaranteed cost to using iterators as such, but there is a risk in more complex cases that the compiler isn't "sufficiently smart" to fully undo the abstraction. You can find some examples of such situations in the Rust issue tracker.

For custom iterators types there can be some added overhead from checks that are inserted to prevent unsoundness even in the face of mistakes in the Iterator implementation, such as Iterator::size_hint returning a wrong value. The standard library types implement unsafe traits like TrustedLen and TrustedRandomAccess to promise this won't happen, but such traits cannot be implemented for custom iterators in stable Rust.