I agree that we need to be careful about not trying to implement the entire tool described here before releasing anything. A slice of the functionality (no gui, just invoke cargo/rustc, print report to terminal) would be a good start. Once the architecture for that is in place it should be straightforward to add new kinds of report renderers (like flamegraphs).
3 Likes
To clarify, I think the motivation for the tool is:
- the set of correct rustc options for difference profiles can be complex and maybe even changes from release to release
- you need a suite of different tools to fully process the data, e.g. post-processing steps
Seems well-motivated! I feel the "curses-based UI" (as you wrote) is not necessary for a first step.
I also think that a cargo plugin (e.g., cargo self-profile) would be how I would expect to expose the functionality, though I suppose that a standalone tool is nice too. (Particularly for those not using cargo, a group which is probably over-represented in those with large programs in need of profiling.)
Anyway I like the plan in general. Creating a MVP seems good too.
1 Like
Yes, that's correct.
Hi hi. I was riffing about profiling tooling on Twitter today, and was asked to share some of that here. Admittedly I know very little about the current status of profiling tooling, so apologies if anything I say is redundant (which seems likely).
Questions I'd like to ask
I don't know much about the compiler, but if I was to try and improve performance I'd probably ask some of these questions:
- How much time are we spending reading files from disk?
- Are there any peaks / drops in throughput during compilation? Why?
- How much are we caching? If we're not caching, where do we spend our time?
In the rest of this post I try and answer how we may be able to answer those questions.
10k ft summaries
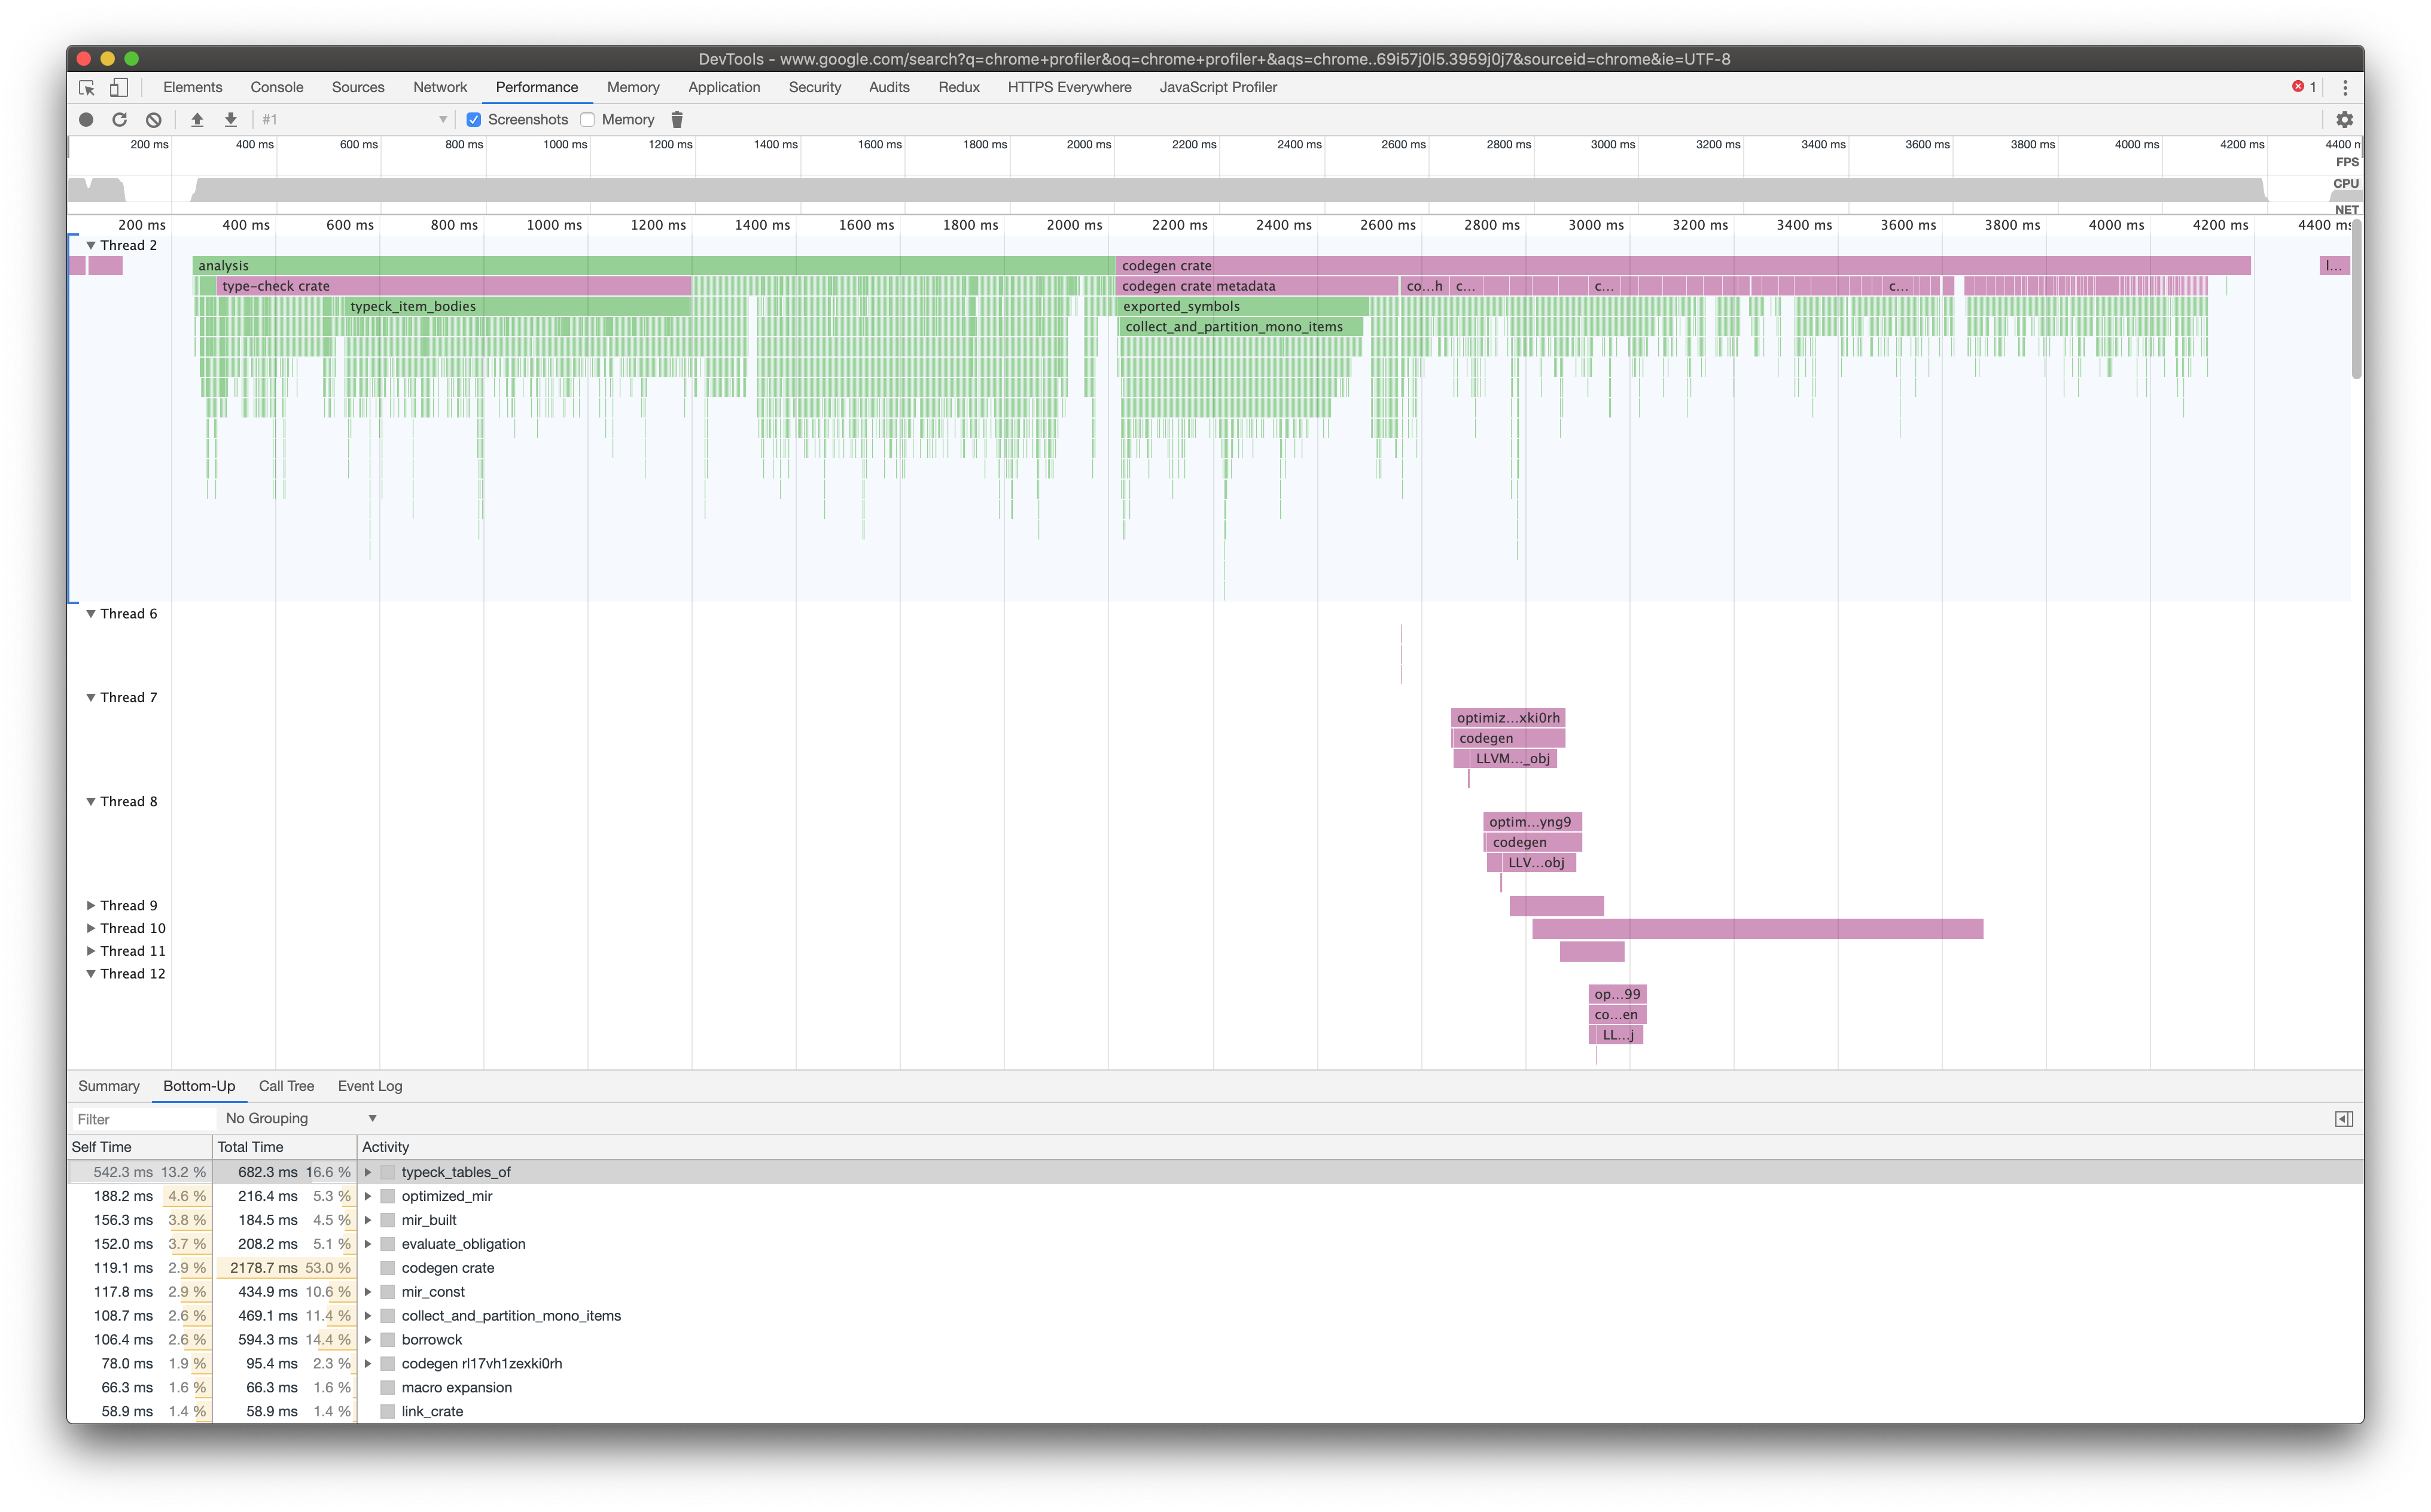
Something that the browser offers that I haven't really seen in other debuggers is the ability to create custom PerformanceEntries that shadow/overlay the program's stack traces. This more or less allows summarizing what is going on instead of looking at how things are executed (which is what stack traces provide).
An example timeline of this in the browser looks like this:
"user timing" overlays the main thread's stack traces, annotating it with with info about "what" is going on, rather than "how"
What I'm thinking might make sense for the compiler is to do something similar for the query graph. Each query could be annotated with:
- How long it took
- What kind of query it is (perhaps color-code different kinds. Afaik there's less only a handful of categories)
- Whether it hit the cache or not (not sure about the impl, but I'm sure it's possible)
It seems the measureme crox command at least already captures some of these annotations ("typecheck crate" doesn't look like a stack trace to me), but having a flamegraph of only these annotations might surface interesting details about what's going on.
An interesting thing about these annotations is that if done right, you can measure the actual time of execution. Which is to say: unlike a regular flame graph it wouldn't measure time on-cpu, but mark a start+end time, and then compute actual time spent. This might surface interesting facts about IO-blocked tasks that could otherwise be missed by perf et al. Also it's probably easiest to log these annotations without descriminating between threads, which makes it easier to paint a full picture of what's happening.
Additionally it would be interesting to be able to toggle events that hit the cache off to see where time is spent outside of the cache. (Also doing the inverse might be interesting -- only show events that hit the cache. Is there such a thing as a slow path when hitting the cache?)
Spotting patterns
Something I think might be interesting to apply to the compiler is flame scopes. A "flame scope" visually lays out event counts over time, and allows detecting patterns. An example:
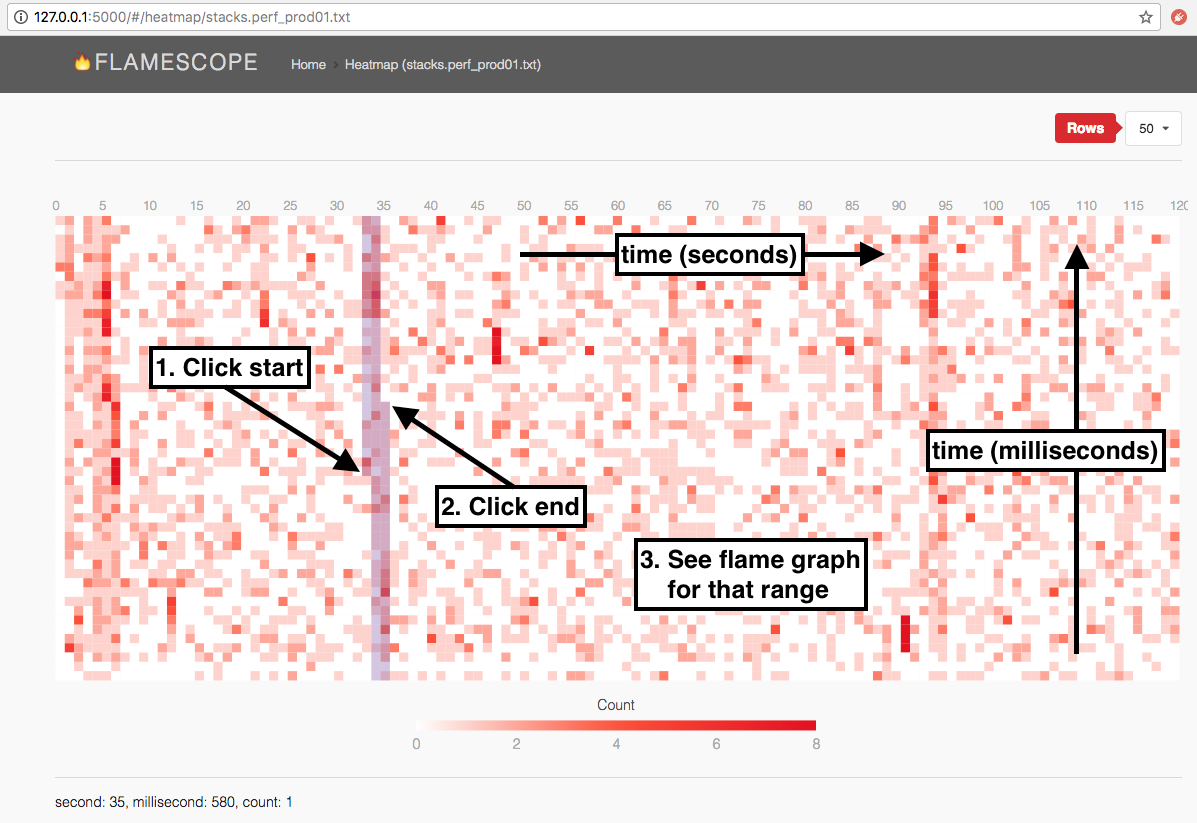
In a compiler run the compiler would ideally be at 100% CPU all the time. If there's a drop in events, it probably means something's blocking execution. By then digging in further it might be possible to get some novel insights.
I've never run flamescope on actual workloads before; but there's certainly been times when I wish I had access to it. I think it'd be interesting to run this on both the "annotations" I mentioned in the previous section, as well on direct perf data. Perhaps even running it on memory or syscall aggregates might surface interesting patterns!
Conclusion
This is some of the stuff I was thinking about might be useful for compiler profiling after I realized it was somewhat similar to things I'd worked on in the past. Perhaps it comes in useful. Thanks for reading!
4 Likes
Hi @yoshuawuyts,
Thanks for the feedback!
It seems the
measureme croxcommand at least already captures some of these annotations
Yes, as you found, we have the tooling in place to generate these kinds of traces. Example
but having a flamegraph of only these annotations might surface interesting details about what's going on.
We also have tooling here to build flamegraphs using the same data as well. Example
An interesting thing about these annotations is that if done right, you can measure the actual time of execution. Which is to say: unlike a regular flame graph it wouldn't measure time on-cpu, but mark a start+end time, and then compute actual time spent. This might surface interesting facts about IO-blocked tasks that could otherwise be missed by
perfet al. Also it's probably easiest to log these annotations without descriminating between threads, which makes it easier to paint a full picture of what's happening.
That's exactly how the events are captured within the compiler so we get those benefits you point out!
Additionally it would be interesting to be able to toggle events that hit the cache off to see where time is spent outside of the cache.
We also have this functionality but it is off by default because it is very expensive to trace cache hits because they occur so frequently. The compiler relies very heavily on this caching and for most queries, (if I recall correctly) the cache hit percent is usually over 99.99% because of the huge number of queries executed. We do have on by default tracing for cache misses but we don't show this data in the Chrome profiler export because it significantly increases the size of the export and often causes the Chrome profiler to give up when trying to load the file.
A "flame scope" visually lays out event counts over time, and allows detecting patterns.
Thanks for the link! I hadn't heard of these before. Depending on what data that tooling expects to get from perf script, we may already be compatible with it or we may need to tweak our code a bit.
4 Likes
This topic was automatically closed 90 days after the last reply. New replies are no longer allowed.